SLOW
Slow down your distraction
Speed up your work
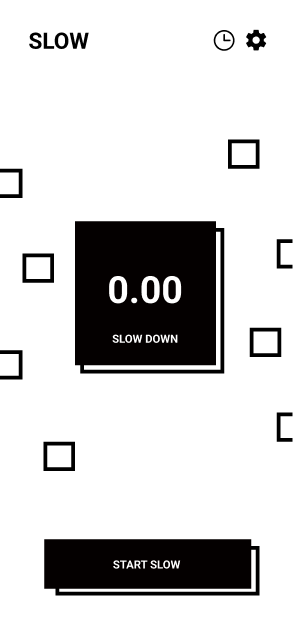
Slow down your distraction
Speed up your work

Let's face it.
There are so many distracting apps in our smartphone. Although they're not necessarily bad, it's easy for us to get distracted by these apps.
SLOW helps you become more aware of phone usage and allow you to take back control of your time.
When you use distracting apps, SLOW introduces gradually increasing artificial friction that makes the user experience less satisfying.
Phone addiction is real. Roughly 85% of the American population owns a smartphone, and about 16% of adolescents are defined to have a smartphone addiction.
Apps such as Tiktok and Instagram are designed to consume as much of the users time and attention as possible. Features such as infinite scrolling and constant feedback keep the user constantly engaged, and encourage little reflection on the amount and quality of content consumed.
Instead of completely blocking users from apps, SLOW adds friction, and make distracting app usage less satisfying. SLOW will throttle network traffic to increase loading times when user uses distracting websites. SLOW’s target audience is for people who use their computer for studying and working but have trouble focusing because of distracting websites. A prototype version of SLOW is a Google Chrome extension.
Designing
Project prototype specification was discussed and a plan for a prototype has been created and individual evaluation plan draft was created.
Prototyping
With the created prototype specification, the team refactored the alpha version of the project and have added key features such as rate limiting control, intensity settings, etc. Project backends are now using Nginx as reverse proxy, pm2 as a service manager, and has a public api endpoint.
Testing
After testing the prototype ourselves, we've asked test participants to test the prototype when they could.
Evaluation
From data collected from our participants, we've started the evaluation of our prototype to determine the effectiveness, efficiency, and usefulness. And we've used statistical methods for determining the significance of changes in user behavior before and after using SLOW.
Final Report
We've worked to create a final report for the project with detailed descriptions of our project.
Character
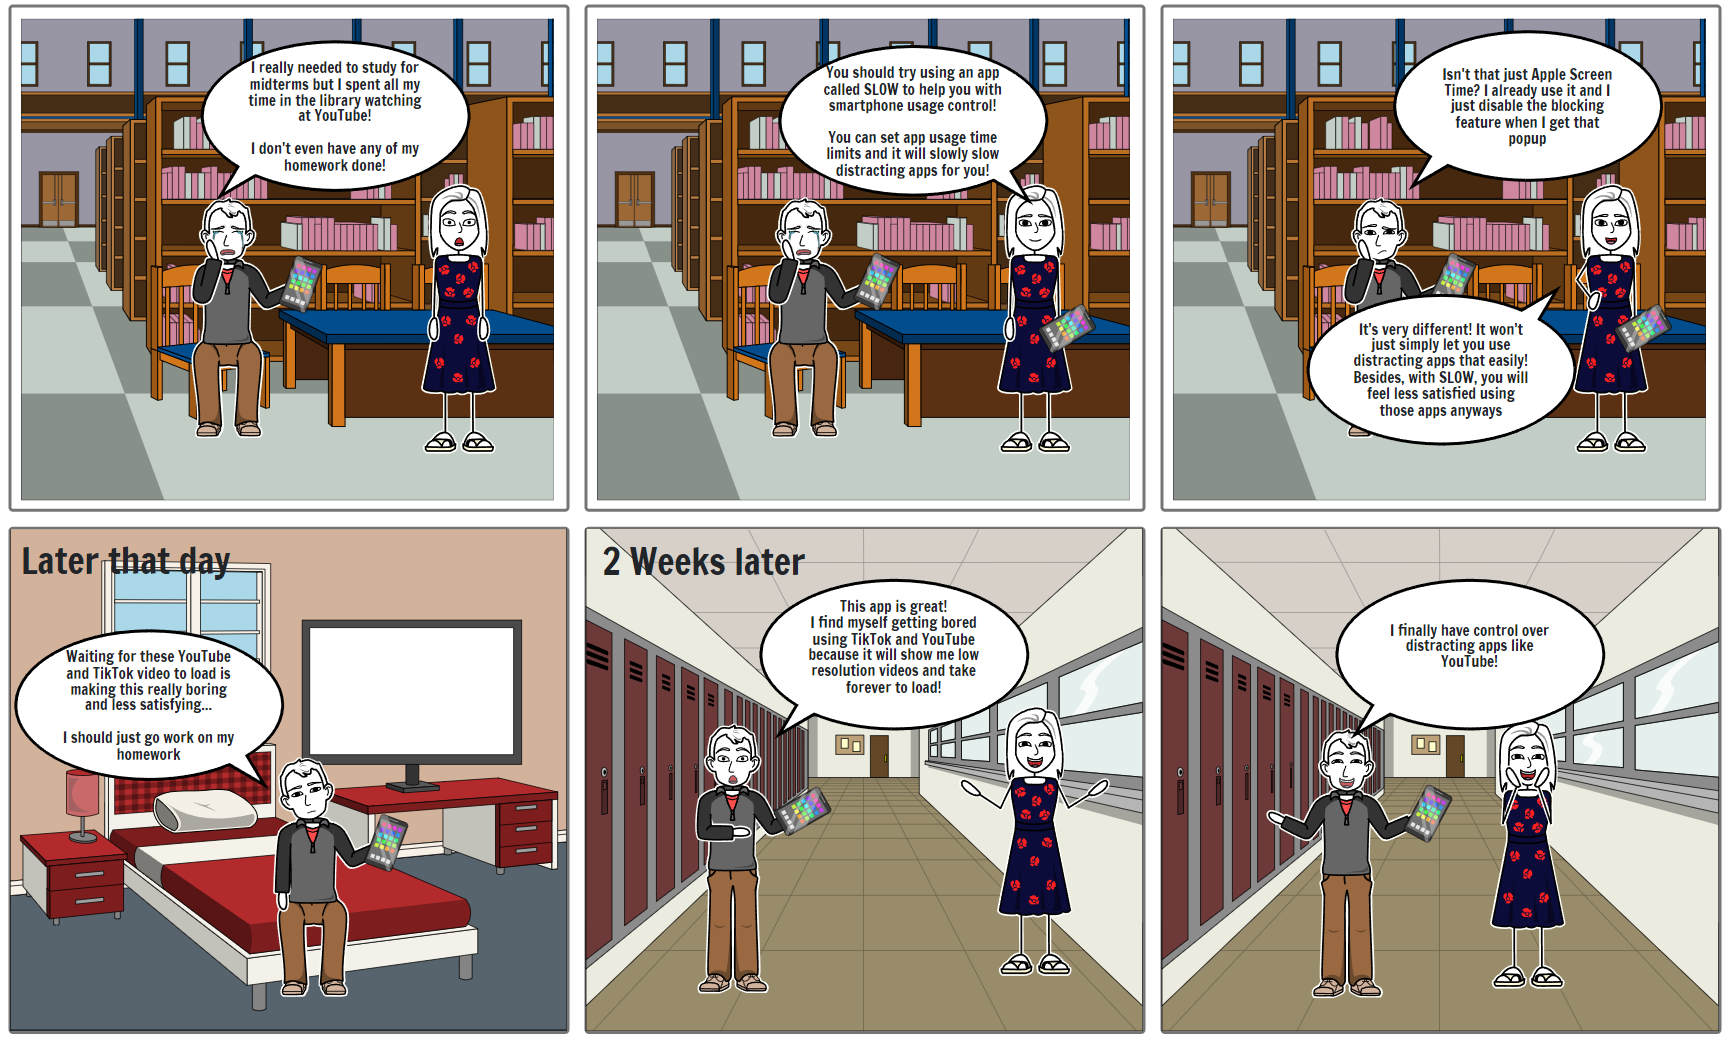
Justin
Setting
School
Pain Point
Justin has important school work to do but is distracted by apps on his phone
Goal
Justin needs to spend less time distracted on his phone when he has important things to do
Solution
Justin can use SLOW to help him reduce time spent on distracting apps
How the goal is achieved
By using SLOW, Justin is able to only use distracting apps for limited amount of time and notice when he is unintentionally using them
Narrative
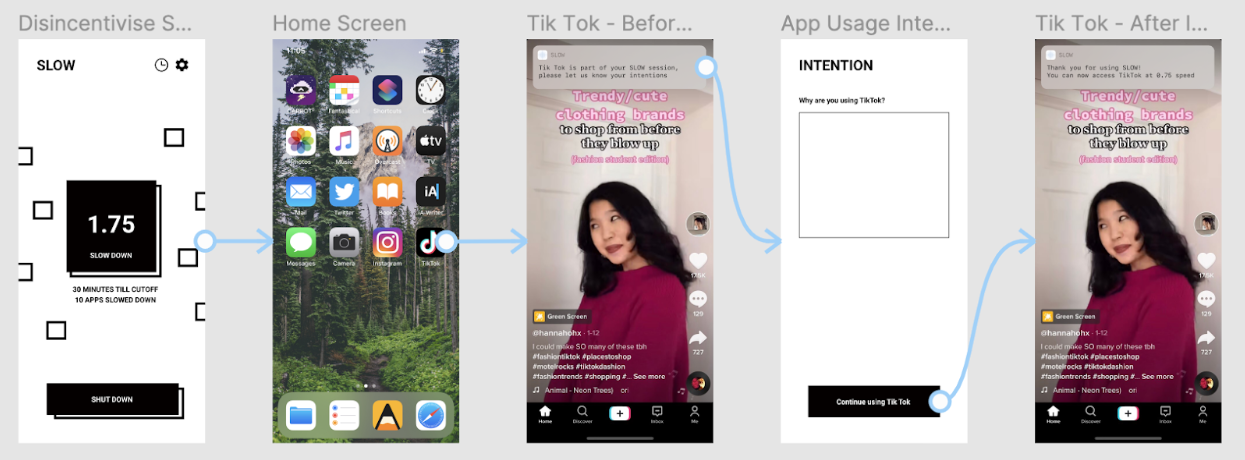
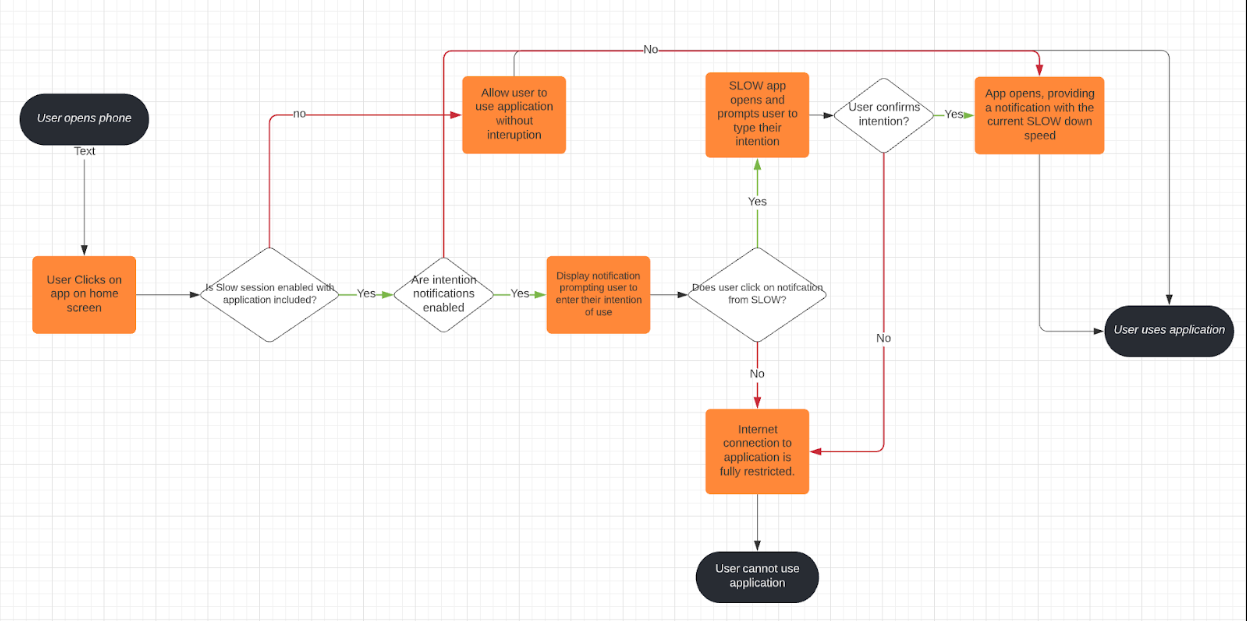
Application should make it harder for user to access distracting apps by pushing a notification that asks for usage intentions. After the user has enabled a SLOW session and specified the applications they want to limit, the below user flow shows what the user will experience when the user tries to use a limited application.


The application should allow the user to set goals. Below you can see the flow of enabling a slow session, where the user is given the option to set their goals through a series of settings. Once all settings have been set, the SLOW session begins.
With project timeline and scope in consideration, we've decided to create a Chrome extension for the working prototype and implement three userflows.
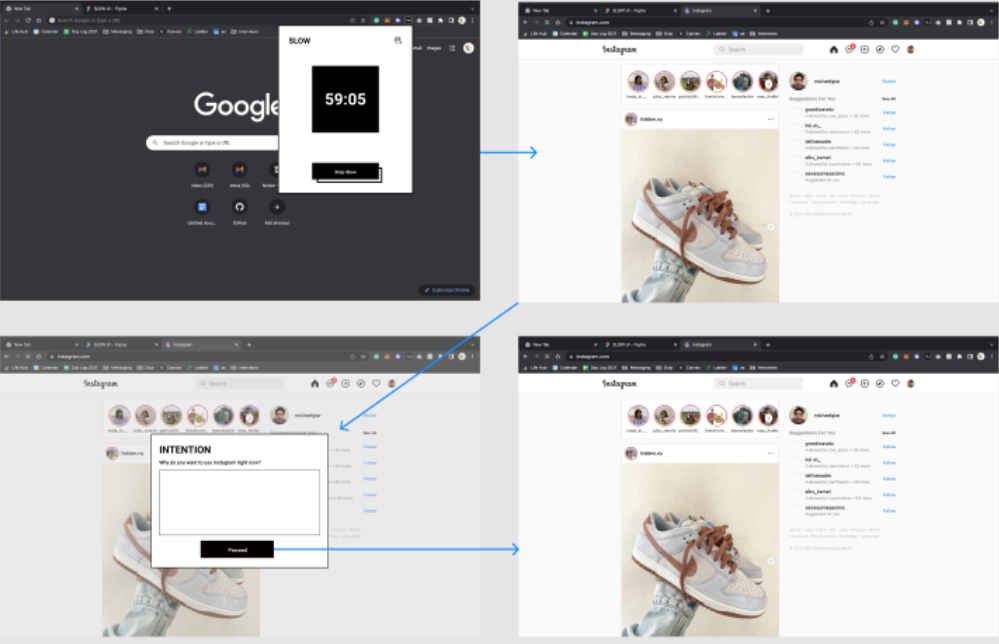
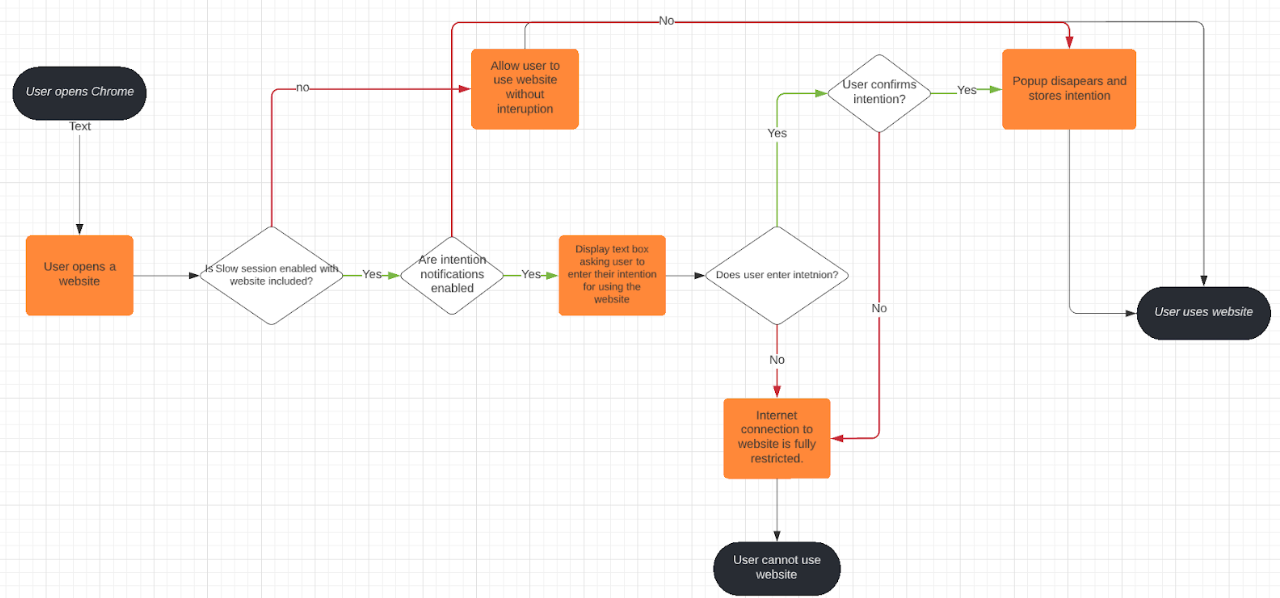
SLOW should enable users to be more intentional about their usage of distracting applications. One common theme throughout our interviews was that students reported using distracting applications unintentionally. While they would open their device with the intention of answering a message or checking the weather, they often found themselves scrolling through distracting applications like Instagram shortly after.
SLOW attempts to counteract this kind of activity by forcing the user to enter an intention when attempting to access a distracting website. After the user has enabled a SLOW session and specified the applications they want to limit, the flow shown below displays what the user will experience when attempting to access a distracting application. We hope that by entering their intention, the user will be more aware of why they are using distracting applications, and they may reconsider their actions.

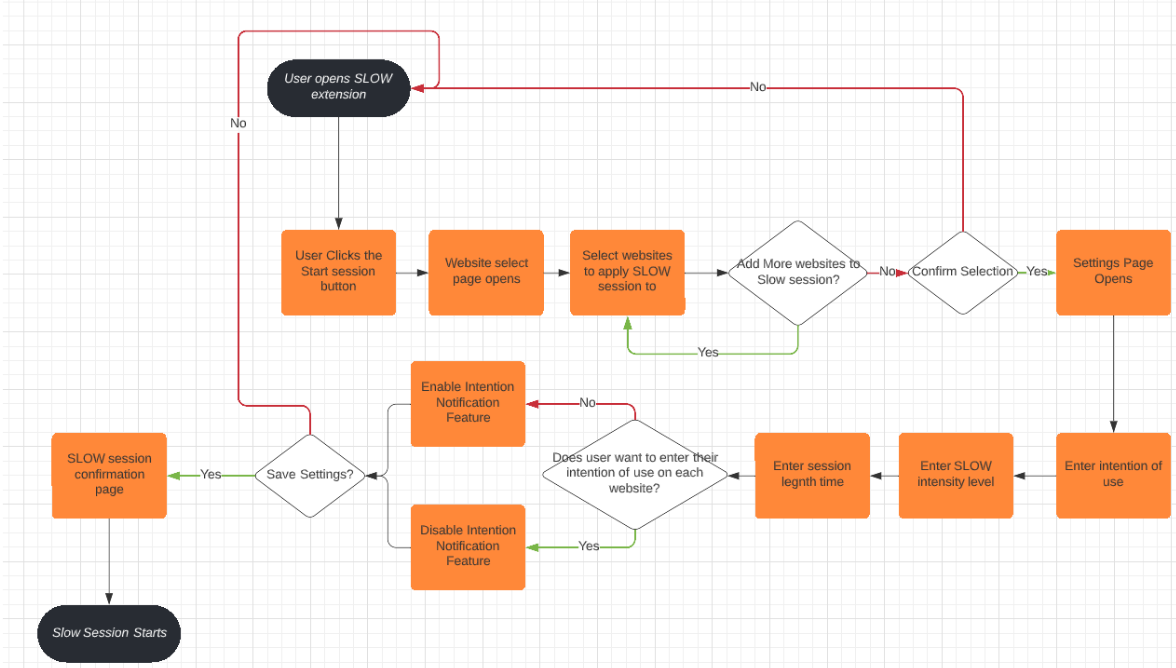
The application should allow the user to set custom usage goals through various settings which affect the intensity and duration of the slow session. After talking to many users, it became clear that different individuals had different goals for their device usage, and these individual goals changed depending on external factors such as school, work, etc.
Below you can see the flow of enabling a SLOW session, where the user is given the option to set their goals through a series of settings. Once all settings have been set, the SLOW session begins. The purpose of this flow is to allow the user to customize their session to fit their needs and mentally set a goal that they would like to get work done during the specified session time.

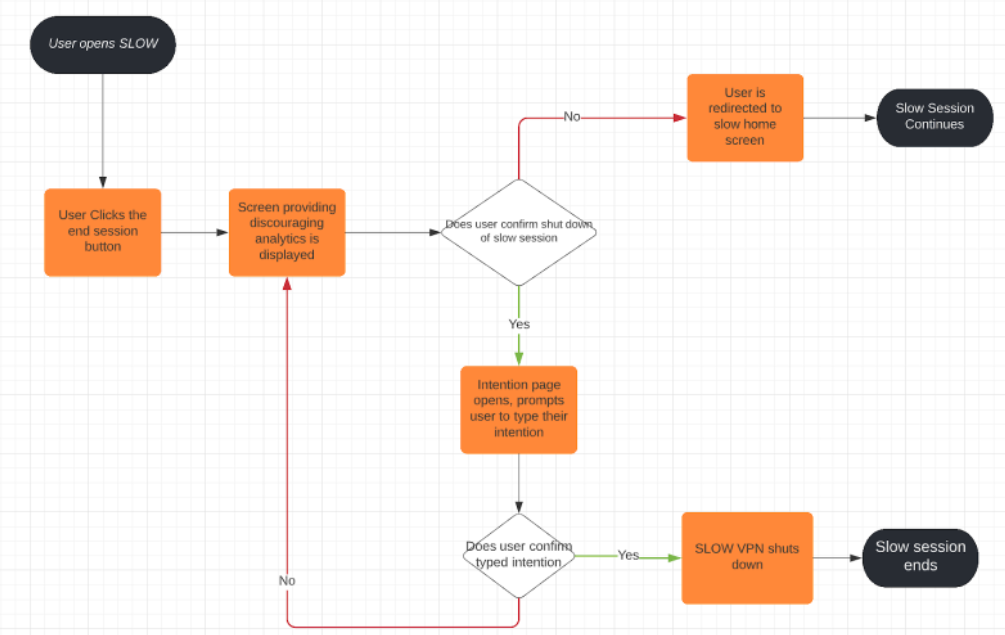
The application will try to discourage the user from turning off their session before the timer they have set has ended. After speaking to many users about their experience with existing screen time limiting applications, we found that many users lacked the self control to not turn off filters when they wanted to use an application. Since SLOW does not completely block users from using applications, we do not believe impulsive shutdown will be as much of an issue, however we still wanted to take measures to combat this activity.
When the user attempts to end a SLOW session before the timer has completed they will be shown analytics for how much time is left in the session to attempt to discourage them from turning the application off. We intentionally used very discouraging language, choosing to use terms like “I give up” instead of “shut down”. After this initial screen, the user will be prompted to enter their intention for turning off the session. We hope this will prompt the user to once again reconsider their actions. After entering their intention, the user is able to disable the session.
The data gathered from log collection during user observation sessions were pre-processed and labeled so that it would have timestamp, whether the visited website was distracting, whether SLOW session was ongoing, the url of the website, and total amount of time spent on the website. When organized, the rows of data looked like the diagram below.
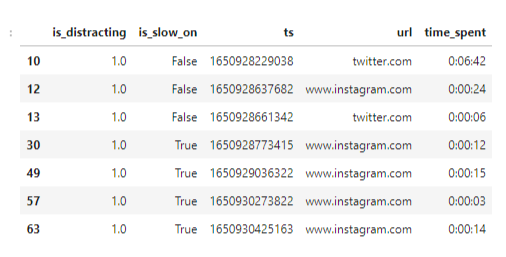
With these columns, we’ve looked into different aspects of the data to look for any meaningful insights.
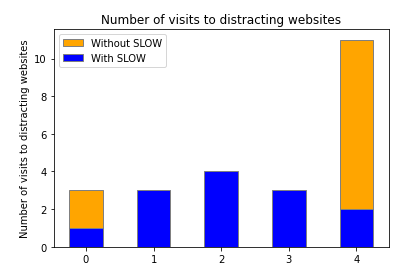

First, when we looked at the number of visits to distracting websites, we observed that there wasn’t a significant difference between when the SLOW session was turned off and it was turned on. The t-test resulted in a p-value of 0.244 with the null hypothesis that the user visited distracting websites less frequently when SLOW was turned on. This meant that the frequency of visits to distracting websites had no significant difference when SLOW was turned on. Since the purpose of SLOW is to help users notice when they’re visiting distracting websites, we concluded that just simply having a SLOW session turned on did not discourage users from visiting the website upon first using it. However, the statistics do not paint the entire picture. SLOW is an app that works by weaning off users’ habits by creating friction. An hour-long test session is not enough to make users permanently change their habits. This shows that longer term testing will be a better indicator of whether or not the app is effective in that regard.
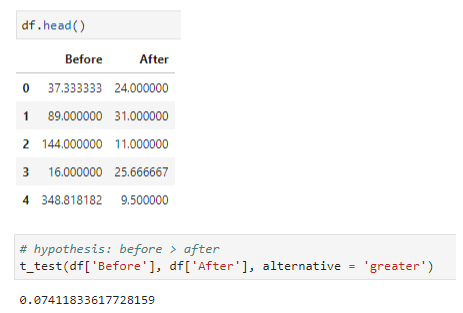
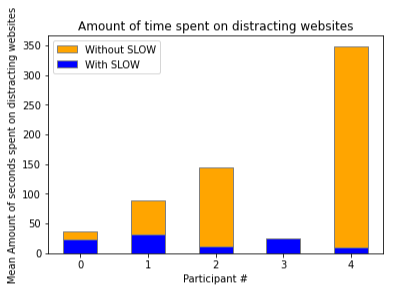
However, the analysis of time spent on distracting websites had some interesting results. The p-value of the t-test was 0.0741 and we find that this is slightly less than our of significance level of 0.075. The reason why we chose a more lenient confidence interval is because our product does not necessitate a very low confidence interval as there can be some variability in the way different participants use their browsers. We’re confident that 7.5% is also a good enough confidence interval to capture whether or not there was a meaningful decrease in the time spent on distracting websites. The trend in the data shows that there has been a meaningful change when users were visiting distracting websites during SLOW sessions. And when we’ve looked at the head of the data, we could visibly notice the difference in the amount of time spent on distracting websites.
The survey data gathered showed some interesting results. For some background, our users reported spending an average time of around 4 hours each on social media each day, and about 5-8 hours studying.
Below you will find screenshots of the results of the questions we asked related to the users experience with SLOW. We walked through the survey with the users before having them to complete it to make sure they understood our instructions. And could answer the questions accurately.
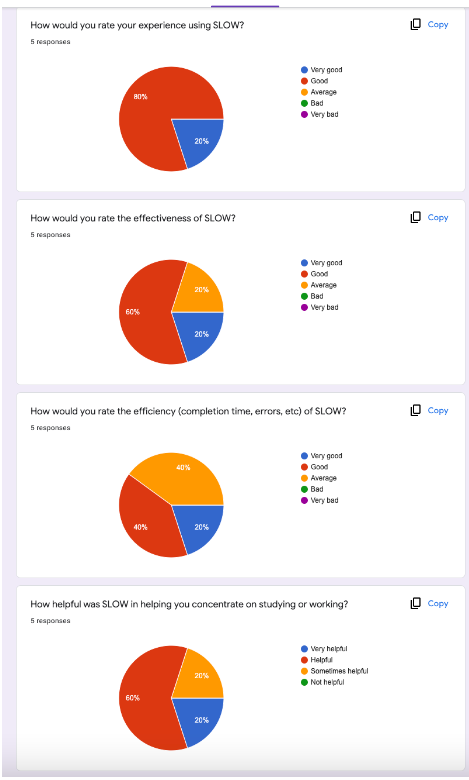
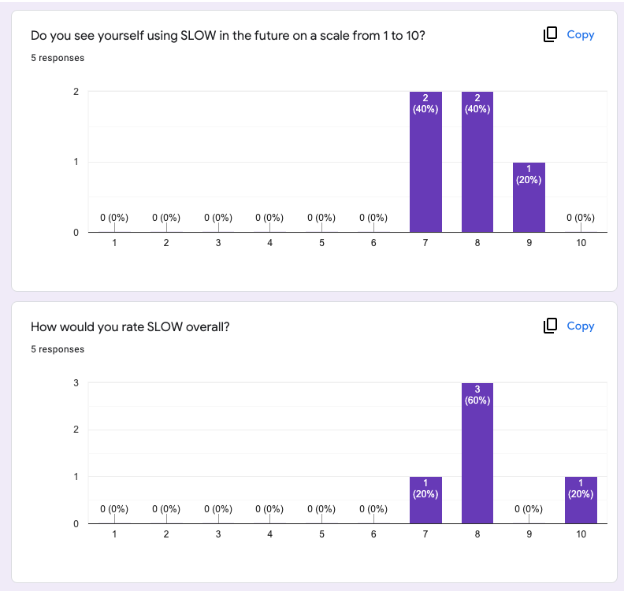
Overall, the results we received were positive, and coincide with the positive results we received from our data. Not shown above is the results from our questions related to the current solutions on the market. Overall, SLOW received more positive responses related to the effectiveness of the application, and similar scores for efficiency and user experience. This is positive, as while the current solutions may not be effective, they are efficient and well designed.
With this being said, many users had comments related to how we could improve the effectiveness of the application. While they were excited about the idea of the application, they largely felt like the application would be better suited for mobile. Most users felt that a majority of their consumption of distracting applications happens on their phone, and could not be well measured in the span of an hour of study.